Last Updated on July 20, 2020 by kevin
Similar numbers, different meaning
Client reporting is tricky. Reporting tools, client portals, your own presentation formats – they all present information in different ways and spur different reactions from clients. Some good, some not so much.
How information is presented (how it’s organized, what is highlighted, what is absent) has a huge impact on how clients interpret and feel about the information you provide. Two rarely discussed factors have a big impact. Before we talk about these two factors, let’s take a look at the report summaries below.
Which situation is better?
Summary A
Summary B
I can hear you all screaming, “What about the client’s goals? Where are they compared to plan?” I hear you, but let’s set that aside for a minute. Because before any of you had processed that thought, your brain had an instantaneous reaction to the numbers.
Most of you experienced a simple sense that Summary B is better, and then began to think critically about the numbers.
Here’s the catch: These two different summaries are of the same client.
Report with a view(point)
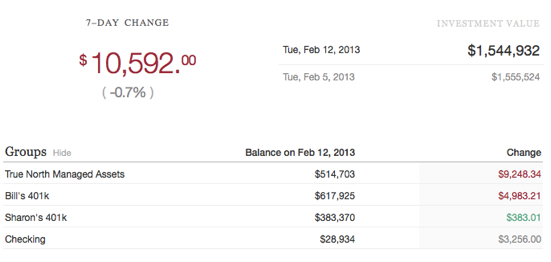
Summary A shows only what the advisor manages directly, an incomplete and somewhat misleading view. Summary B shows the whole picture. It puts volatility, gains and losses and other more focused or detailed information you might provide in context.
The context of the client information you present determines how your clients process the information that you share with them. Will they get it? Will they respond appropriately?
Here is a list of the client’s accounts as they might be shown in a client portal like Blueleaf:

Missing the big picture means a fuzzy picture
Unfortunately, most vendors of client reporting software for advisors take the approach that all this important context is superfluous because these assets are “held-away”. Many advisors make this mistake too.
When you combine this with the too common design principle “comprehensive reporting” (read data dump), the result is that most client reports pack in all kinds of detail without much summary information or context to guide clients. The result is confusion, misinterpretation and potentially to losing clients.
The keys to communication: Summarization & Context
Summarization: Opening with a simple summary leverages a client behavioral tendency called anchoring to help them evaluate your information properly rather than through a warped lens. Essentially it means they’ll have that summary picture in mind as they evaluate at any other details. That makes the clients job much easier.
Context: By organizing information around a complete view of a client’s assets your summary conveys context. In fact all the context of the client’s situation. Swings in value are viewed from the perspective of their complete portfolio. In other words, any swings in the value of a single account are viewed proportionately to the total.
Clients are happier and have a perspective that reflects reality. Everyone wins.
No one designs a financial plan or investment policy in a vacuum. Why would you report from one?
If your firm’s client portal software or client reporting system doesn’t allow you to easily have all this information at your finger tips and deliver it in a simple context-driven way, find a new system. You can do it yourself, or find a system like Blueleaf to help. No matter what approach you take, do it now.
Next we’ll talk about how information frequency and availability impacts clients. Hint: It’s not even close to what you think …
Also published on Medium.


